
NE SCIENCE & TECH BUREAU
CHENNAI, DEC 3
![]()
Astronomers have decoded how the Sun’s magnetic activity varies across latitudes using a novel analytical technique, drawing on an 11-year dataset from the historic Kodaikanal Solar Observatory. The study pinpoints the exact latitude zones where magnetic forces intensify—insights that could sharpen predictions of space weather patterns influencing satellite communication, navigation systems and even terrestrial power grids.
Kodaikanal Solar Observatory data helps tracing solar magnetic activity influencing satellite communication
Astronomers have traced the variation of the Sun's magnetic activity with latitude using a new technique
The study which identified concentration of solar activity with… pic.twitter.com/F4NZhAnO4m
— PIB India (@PIB_India) December 3, 2025
Solar activity, driven by the Sun’s magnetic dynamo, follows an approximately 11-year cycle. Mapping how these magnetic zones migrate helps scientists understand phenomena such as sunspots, solar flares, and coronal mass ejections—all of which have direct consequences for Earth.
- 11-year Ca–K spectral dataset helps map shifting magnetic bands driving solar cycles
- Findings improve understanding of space weather impacting satellites and communication systems
- IIA team identifies precise latitude zones where magnetic activity and sunspot peaks emerge
In the new study, astronomers at the Indian Institute of Astrophysics (IIA), an autonomous institute under the Department of Science and Technology (DST), analysed calcium K line spectroscopic observations recorded between 2015 and 2025. The Ca-K line at 393.4 nm, originating from the Sun’s chromosphere, is a powerful diagnostic tool for tracking magnetic variations in this upper layer.
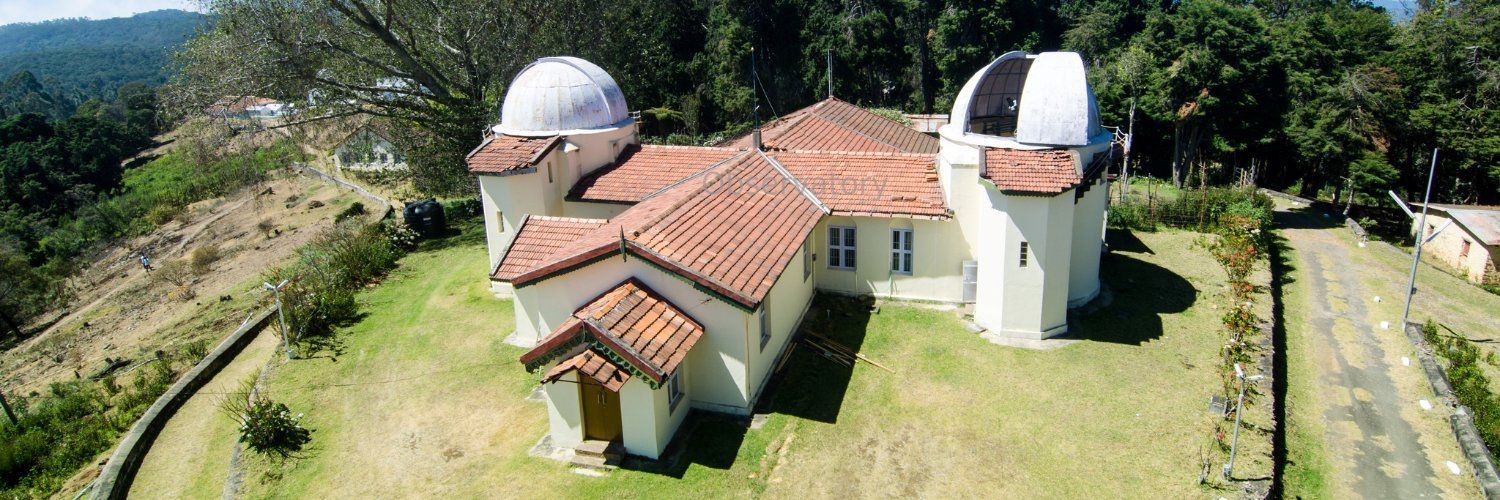
The Kodaikanal Solar Observatory—now 125 years old—continues to provide uninterrupted daily solar observations, contributing one of the world’s most valuable long-term solar datasets.
The research team used Ca–K spectral measurements to monitor magnetic behaviour across latitude bands, tracing its evolution from the peak of Solar Cycle 24 to the rise of Solar Cycle 25. Instead of tracking individual sunspots, scientists applied a technique developed by IIA professor Jagdev Singh to analyse combined light from entire latitude strips.
“Rather than looking at individual sunspots or magnetic regions, we used an earlier technique devised by our team member and professor at IIA, Jagdev Singh, that captures light from entire latitude bands, slicing the Sun into horizontal strips from pole to pole and analyzing the combined light from each strip,” said K.P. Raju of the Indian Institute of Astrophysics. The method, he noted, reveals large-scale magnetic patterns invisible to narrower studies. By examining features such as line widths and intensity ratios, the team tracked how these spectral indicators shifted over 11 years.
The findings were clear and striking
“The data revealed clear patterns showing that most solar activity concentrates between 40 degrees north and south latitudes, with particularly strong signals around 15–20 degrees in both hemispheres of the Sun, exactly where sunspot activity peaks during the solar cycle. The spectral measurements showed direct correlations with the actual coverage of magnetic features on the Sun’s surface, confirmed through filling factor analysis using NASA’s Solar Dynamics Observatory data,” explained K. Nagarju, faculty at IIA and co-author.
The team also observed persistent hemispheric asymmetries, with the southern hemisphere showing steeper magnetic activity gradients at higher latitudes. Their calculations of “spectral response profiles”—measuring how spectral lines change with increasing magnetic filling factor—revealed systematic north–south differences that help decode the behaviour of the Sun’s magnetic engine.
Summarising the broader significance, Apoorva Srinivasa, former IIA intern and now PhD scholar at Amrita Vishwa Vidyapeetham, said,
“Our results confirm that solar activity follows predictable patterns related to the 11-year solar cycle, with the strongest magnetic activity occurring in specific latitude bands that shift over time. The observed variations directly reflect changes in temperature and magnetic field strength across the Sun’s chromosphere, contributing to our broader understanding of how the Sun’s magnetic dynamo operates.”
The study was published in the Monthly Notices of the Royal Astronomical Society. Other contributors include Anu Sreedevi (IIT BHU and former IIA intern), Narayanankutty Karuppath (Amrita Vishwa Vidyapeetham), and P. Devendran, T. Ramesh Kumar, and P. Kumaravel of IIA.